Dashboards
Combine questions into interactive views with shared filters
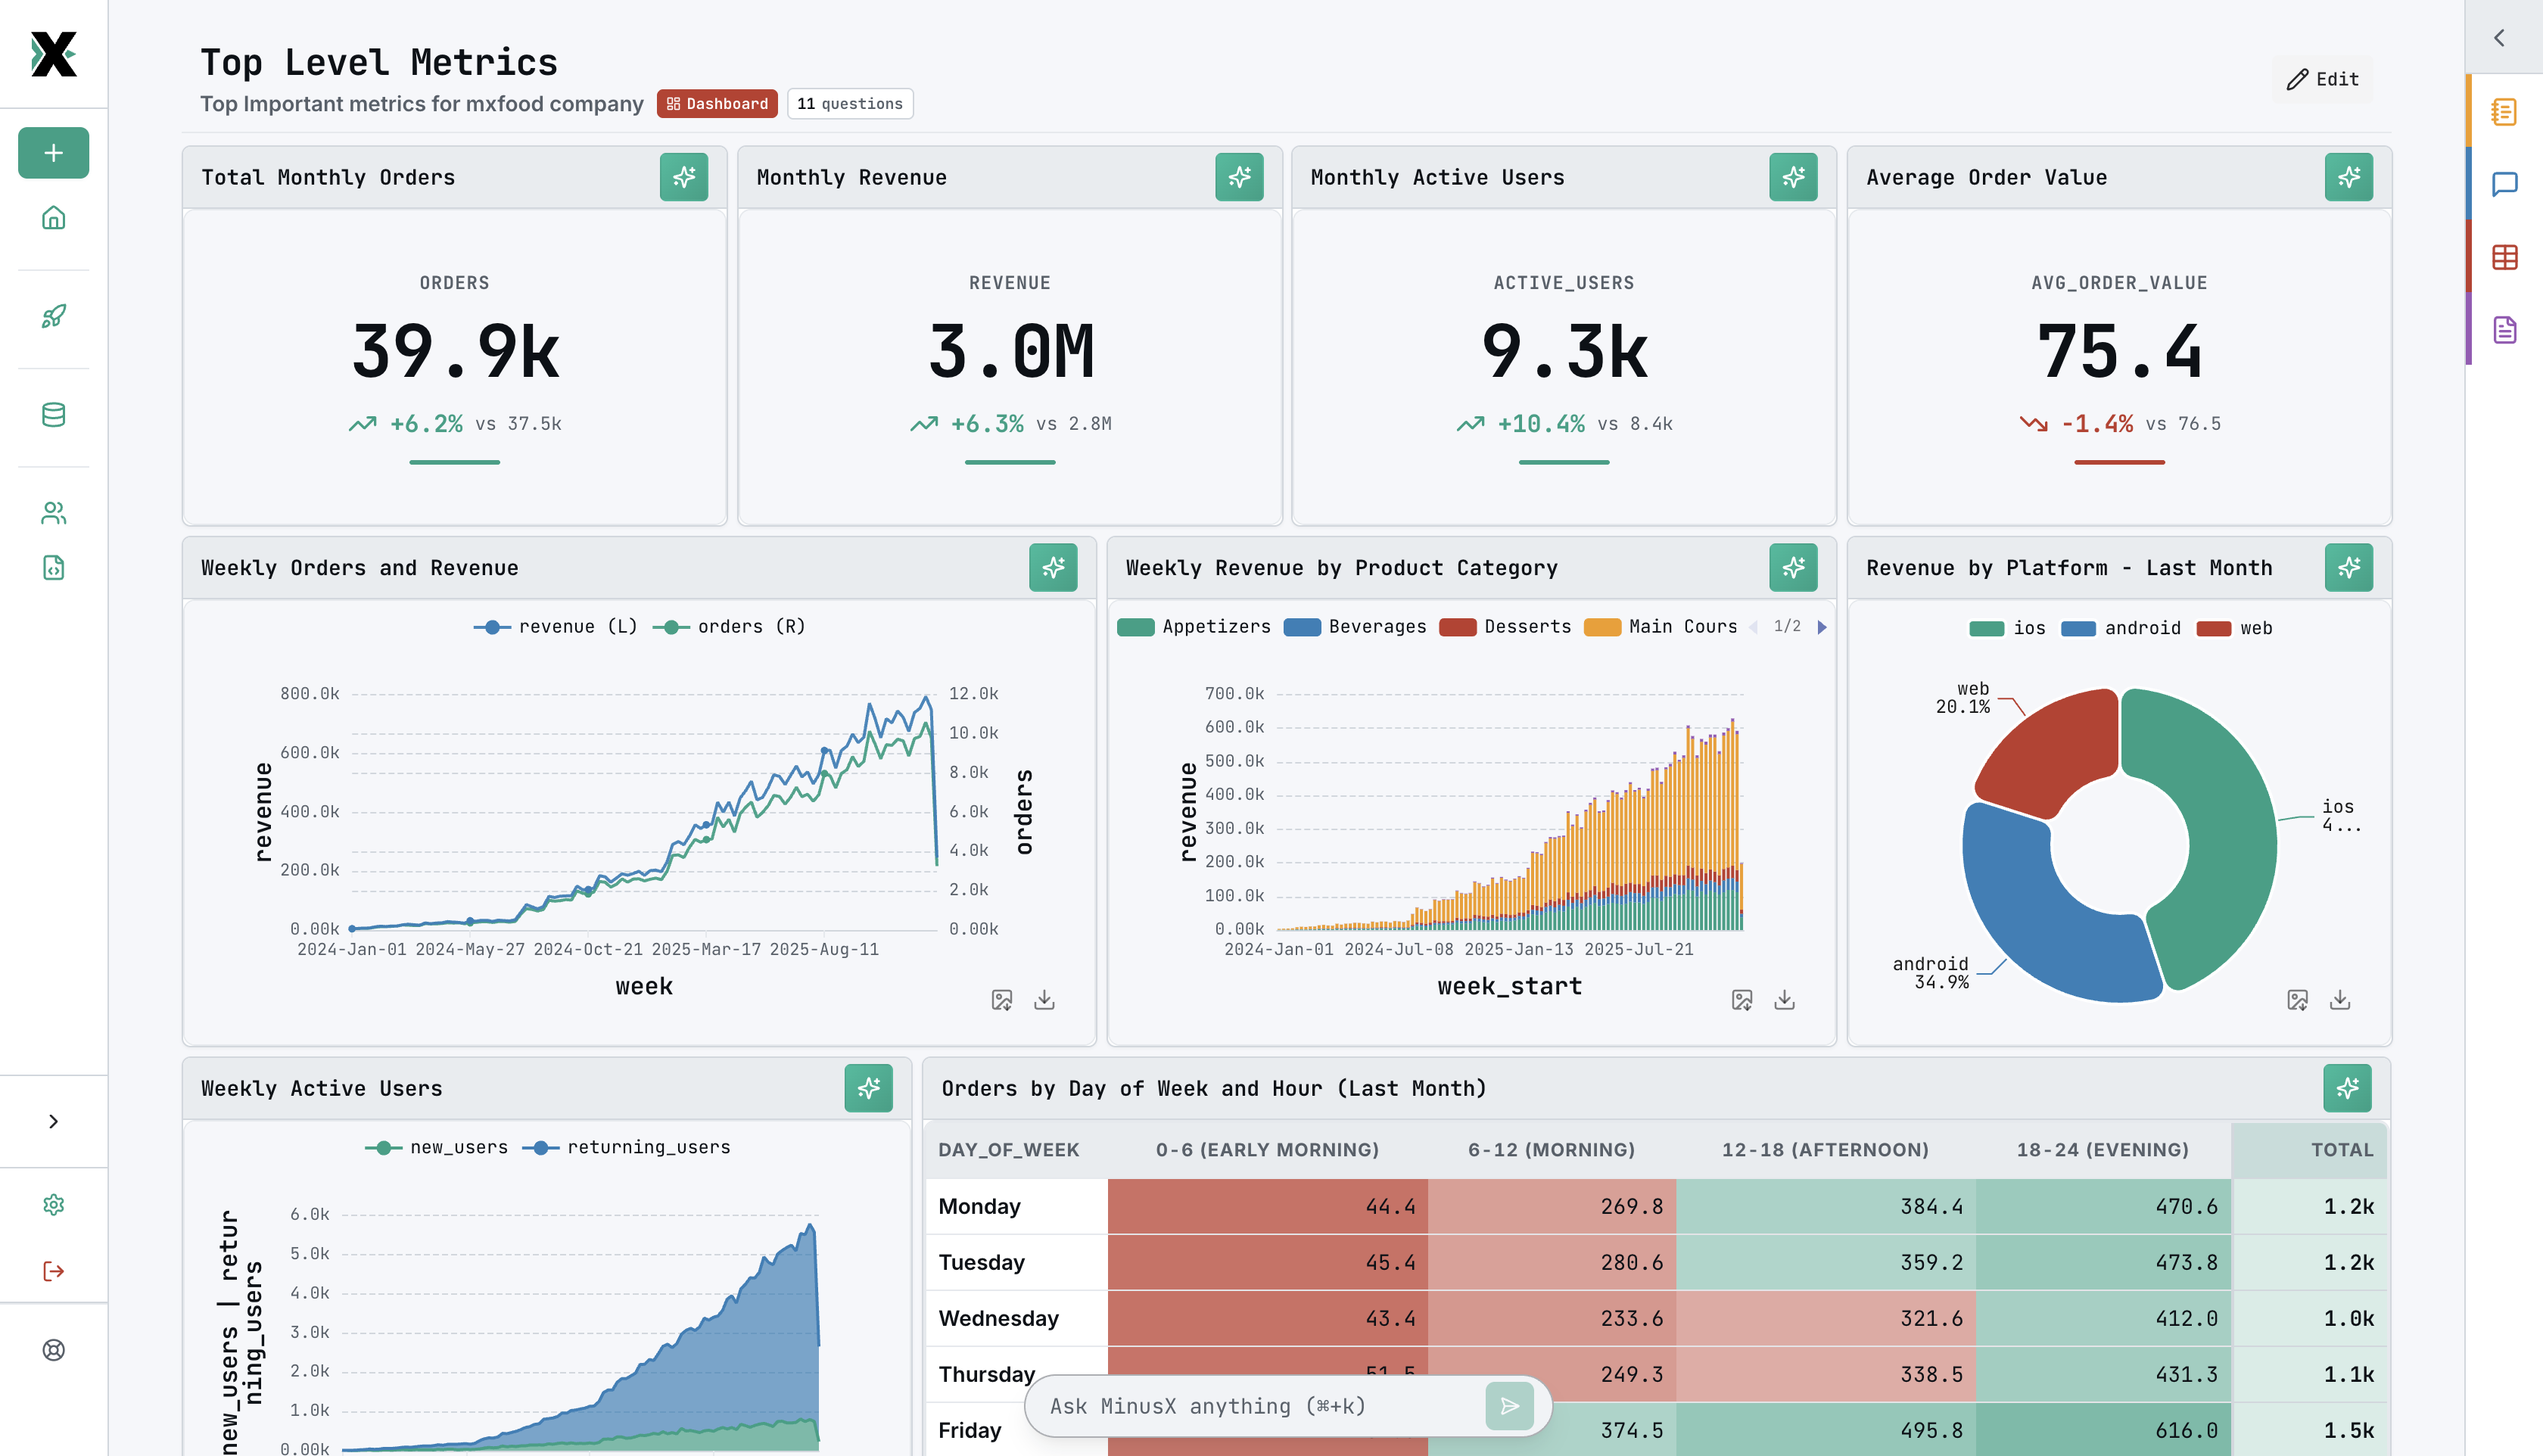
A dashboard is a collection of questions and text blocks arranged in a grid layout with shared parameters for interactive filtering.
Creating a dashboard
Create a dashboard from the sidebar by clicking New → Dashboard. Then:
- Add content — add saved questions, create new ones, or insert text blocks for context and commentary
- Arrange the layout — drag and resize cards in the grid
- Save — give it a name and save to a folder
Layout
Each card can be:
- Moved — drag to reposition
- Resized — drag edges to change size
Put key metrics at the top, detailed charts in the middle, supporting tables at the bottom.
Text blocks
Dashboards support markdown text blocks alongside questions — useful for adding titles, descriptions, commentary, or section headers.
- Click Add Text Block to insert one
- Edit using a built-in markdown editor
- Text blocks can be repositioned and resized just like question cards
- Supports standard markdown formatting (headings, bold, lists, links, etc.)
Dashboard parameters
When questions use parameters with the same name and type, they automatically merge into dashboard-level filters.
For example, if three questions all use :start_date (type: date), the dashboard shows a single date picker that controls all three.
- Parameters merge by name + type — both must match
- Parameter types are locked in dashboard view
- Changing a filter re-executes all affected questions
AI-assisted dashboards
Use the chat sidebar to build dashboards conversationally:
- "Create a sales dashboard with monthly revenue, top products, and customer count"
- "Add a line chart showing weekly signups"
- "Add a date range filter"
- "Add a text block with a summary header"
The agent creates questions, configures visualizations, and arranges the layout.